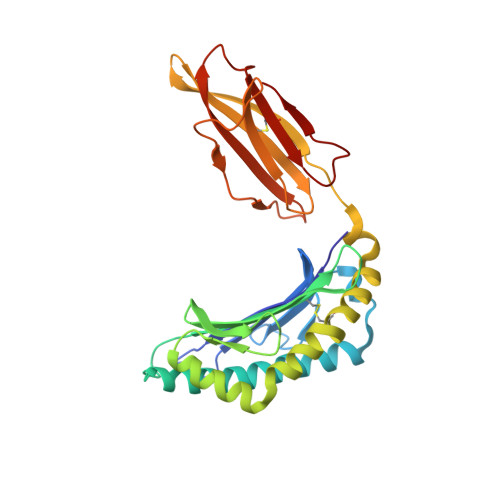
1KTL

The human non-classical major histocompatibility complex molecule HLA-E


Experimental Data Snapshot

  • Method: X-RAY DIFFRACTION
  • Resolution: 3.10 Å
  • R-Value Free: 0.280 
  • R-Value Work: 0.238 

Starting Model: experimental
View more details

wwPDB Validation   3D Report Full Report


This is version 1.5 of the entry. See complete history


Literature

HLA-E allelic variants: Correlating differential expression, peptide affinities, crystal structures and thermal stabilities

Strong, R.K.Holmes, M.A.Li, P.Braun-Jones, L.Lee, N.Geraghty, D.E.

(2003) J Biol Chem 278: 5082-5089

  • DOI: https://doi.org/10.1074/jbc.M208268200
  • Primary Citation of Related Structures:  
    1KPR, 1KTL

  • PubMed Abstract: 

    Previous studies of HLA-E allelic polymorphism have indicated that balancing selection may be acting to maintain two major alleles in most populations, indicating that a functional difference may exist between the alleles. The alleles differ at only one amino acid position, where an arginine at position 107 in HLA-E*0101 (E(R)) is replaced by a glycine in HLA-E*0103 (E(G)). To investigate possible functional differences, we have undertaken a study of the physical and biochemical properties of these two proteins. By comparing expression levels, we found that whereas steady-state protein levels were similar, the two alleles did in fact differ with respect to cell surface levels. To help explain this difference, we undertook studies of the relative differences in peptide affinity, complex stability, and three-dimensional structure between the alleles. The crystal structures for HLA-E(G) complexed with two distinct peptides were determined, and both were compared with the HLA-E(R) structure. No significant differences in the structure of HLA-E were induced as a result of binding different peptides or by the allelic substitution at position 107. However, there were clear differences in the relative affinity for peptide of each heavy chain, which correlated with and may be explained by differences between their thermal stabilities. These differences were completely consistent with the relative levels of the HLA-E alleles on the cell surface and may indeed correlate with functional differences. This in turn may help explain the apparent balancing selection acting on this locus.


  • Organizational Affiliation

    Division of Basic Sciences, Fred Hutchinson Cancer Research Center, Seattle, Washington 98109, USA. rstrong@fhcrc.org


Macromolecules
Find similar proteins by:  (by identity cutoff)  |  3D Structure
Entity ID: 1
MoleculeChains Sequence LengthOrganismDetailsImage
HLA CLASS I HISTOCOMPATIBILITY ANTIGEN, ALPHA CHAIN
A, C
274Homo sapiensMutation(s): 1 
Gene Names: HLA-E
UniProt & NIH Common Fund Data Resources
Find proteins for P13747 (Homo sapiens)
Explore P13747 
Go to UniProtKB:  P13747
PHAROS:  P13747
GTEx:  ENSG00000204592 
Entity Groups  
Sequence Clusters30% Identity50% Identity70% Identity90% Identity95% Identity100% Identity
UniProt GroupP13747
Sequence Annotations
Expand
  • Reference Sequence
Find similar proteins by:  (by identity cutoff)  |  3D Structure
Entity ID: 2
MoleculeChains Sequence LengthOrganismDetailsImage
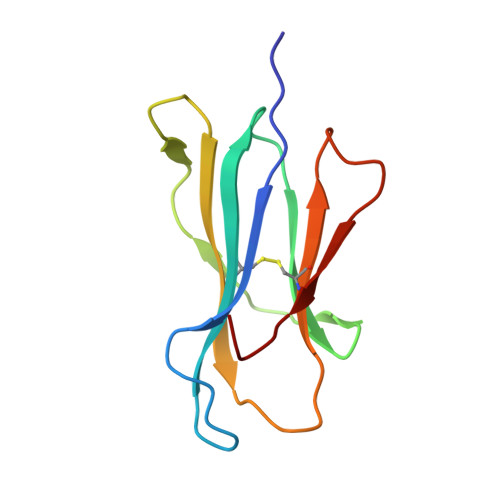
BETA-2-MICROGLOBULIN
B, D
100Homo sapiensMutation(s): 0 
Gene Names: B2M
UniProt & NIH Common Fund Data Resources
Find proteins for P61769 (Homo sapiens)
Explore P61769 
Go to UniProtKB:  P61769
PHAROS:  P61769
GTEx:  ENSG00000166710 
Entity Groups  
Sequence Clusters30% Identity50% Identity70% Identity90% Identity95% Identity100% Identity
UniProt GroupP61769
Sequence Annotations
Expand
  • Reference Sequence

Find similar proteins by:  Sequence   |   3D Structure  

Entity ID: 3
MoleculeChains Sequence LengthOrganismDetailsImage
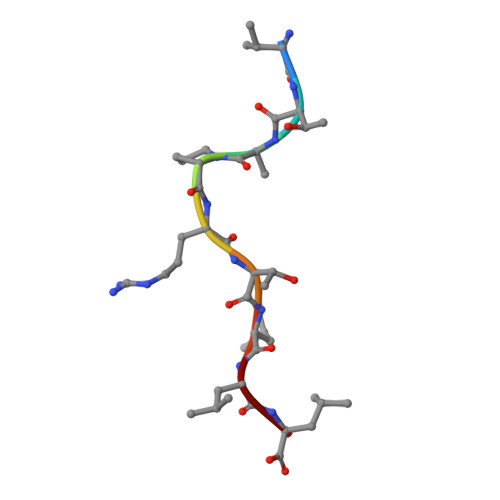
Peptide VTAPRTLLLE [auth P],
F [auth Q]
9N/AMutation(s): 0 
Sequence Annotations
Expand
  • Reference Sequence
Small Molecules
Ligands 1 Unique
IDChains Name / Formula / InChI Key2D Diagram3D Interactions
SO4
Query on SO4

Download Ideal Coordinates CCD File 
G [auth A]SULFATE ION
O4 S
QAOWNCQODCNURD-UHFFFAOYSA-L
Experimental Data & Validation

Experimental Data

  • Method: X-RAY DIFFRACTION
  • Resolution: 3.10 Å
  • R-Value Free: 0.280 
  • R-Value Work: 0.238 
  • Space Group: P 31 2 1
Unit Cell:
Length ( Å )Angle ( ˚ )
a = 178.4α = 90
b = 178.4β = 90
c = 87.3γ = 120
Software Package:
Software NamePurpose
DENZOdata reduction
SCALEPACKdata scaling
CNSrefinement
CNSphasing

Structure Validation

View Full Validation Report


Entry History 

Deposition Data

Revision History  (Full details and data files)

  • Version 1.0: 2003-02-25
    Type: Initial release
  • Version 1.1: 2008-04-27
    Changes: Version format compliance
  • Version 1.2: 2011-07-13
    Changes: Version format compliance
  • Version 1.3: 2021-10-27
    Changes: Database references, Derived calculations
  • Version 1.4: 2023-08-16
    Changes: Data collection, Refinement description
  • Version 1.5: 2024-11-20
    Changes: Structure summary