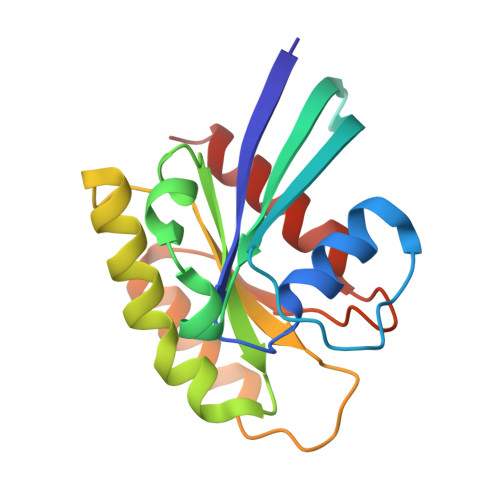
3RSO

H-Ras soaked in 20% S,R,S-bisfuranol: 1 of 10 in MSCS set


Experimental Data Snapshot

  • Method: X-RAY DIFFRACTION
  • Resolution: 1.60 Å
  • R-Value Free: 0.199 
  • R-Value Work: 0.177 
  • R-Value Observed: 0.179 

wwPDB Validation   3D Report Full Report


Ligand Structure Quality Assessment 


This is version 1.4 of the entry. See complete history


Literature

Analysis of Binding Site Hot Spots on the Surface of Ras GTPase.

Buhrman, G.O Connor, C.Zerbe, B.Kearney, B.M.Napoleon, R.Kovrigina, E.A.Vajda, S.Kozakov, D.Kovrigin, E.L.Mattos, C.

(2011) J Mol Biol 413: 773-789

  • DOI: https://doi.org/10.1016/j.jmb.2011.09.011
  • Primary Citation of Related Structures:  
    3RRY, 3RRZ, 3RS0, 3RS2, 3RS3, 3RS4, 3RS5, 3RS7, 3RSL, 3RSO

  • PubMed Abstract: 

    We have recently discovered an allosteric switch in Ras, bringing an additional level of complexity to this GTPase whose mutants are involved in nearly 30% of cancers. Upon activation of the allosteric switch, there is a shift in helix 3/loop 7 associated with a disorder to order transition in the active site. Here, we use a combination of multiple solvent crystal structures and computational solvent mapping (FTMap) to determine binding site hot spots in the "off" and "on" allosteric states of the GTP-bound form of H-Ras. Thirteen sites are revealed, expanding possible target sites for ligand binding well beyond the active site. Comparison of FTMaps for the H and K isoforms reveals essentially identical hot spots. Furthermore, using NMR measurements of spin relaxation, we determined that K-Ras exhibits global conformational dynamics very similar to those we previously reported for H-Ras. We thus hypothesize that the global conformational rearrangement serves as a mechanism for allosteric coupling between the effector interface and remote hot spots in all Ras isoforms. At least with respect to the binding sites involving the G domain, H-Ras is an excellent model for K-Ras and probably N-Ras as well. Ras has so far been elusive as a target for drug design. The present work identifies various unexplored hot spots throughout the entire surface of Ras, extending the focus from the disordered active site to well-ordered locations that should be easier to target.


  • Organizational Affiliation

    Department of Molecular and Structural Biochemistry, North Carolina State University, Raleigh, NC 27695, USA.


Macromolecules
Find similar proteins by:  (by identity cutoff)  |  3D Structure
Entity ID: 1
MoleculeChains Sequence LengthOrganismDetailsImage
GTPase HRas166Homo sapiensMutation(s): 0 
Gene Names: HRASHRAS1
EC: 3.6.5.2
UniProt & NIH Common Fund Data Resources
Find proteins for P01112 (Homo sapiens)
Explore P01112 
Go to UniProtKB:  P01112
PHAROS:  P01112
GTEx:  ENSG00000174775 
Entity Groups  
Sequence Clusters30% Identity50% Identity70% Identity90% Identity95% Identity100% Identity
UniProt GroupP01112
Sequence Annotations
Expand
  • Reference Sequence
Small Molecules
Ligands 4 Unique
IDChains Name / Formula / InChI Key2D Diagram3D Interactions
GNP
Query on GNP

Download Ideal Coordinates CCD File 
B [auth A]PHOSPHOAMINOPHOSPHONIC ACID-GUANYLATE ESTER
C10 H17 N6 O13 P3
UQABYHGXWYXDTK-UUOKFMHZSA-N
RSG
Query on RSG

Download Ideal Coordinates CCD File 
F [auth A],
G [auth A]
(3S,3aR,6aS)-hexahydrofuro[2,3-b]furan-3-ol
C6 H10 O3
RCDXYCHYMULCDZ-PBXRRBTRSA-N
CA
Query on CA

Download Ideal Coordinates CCD File 
C [auth A],
E [auth A]
CALCIUM ION
Ca
BHPQYMZQTOCNFJ-UHFFFAOYSA-N
MG
Query on MG

Download Ideal Coordinates CCD File 
D [auth A]MAGNESIUM ION
Mg
JLVVSXFLKOJNIY-UHFFFAOYSA-N
Experimental Data & Validation

Experimental Data

  • Method: X-RAY DIFFRACTION
  • Resolution: 1.60 Å
  • R-Value Free: 0.199 
  • R-Value Work: 0.177 
  • R-Value Observed: 0.179 
  • Space Group: H 3 2
Unit Cell:
Length ( Å )Angle ( ˚ )
a = 88.496α = 90
b = 88.496β = 90
c = 134.094γ = 120
Software Package:
Software NamePurpose
SCALEPACKdata scaling
PHASERphasing
PHENIXrefinement
PDB_EXTRACTdata extraction
HKL-2000data collection
DENZOdata reduction

Structure Validation

View Full Validation Report


Ligand Structure Quality Assessment 


Entry History 

Deposition Data

Revision History  (Full details and data files)

  • Version 1.0: 2011-09-21
    Type: Initial release
  • Version 1.1: 2011-10-12
    Changes: Database references
  • Version 1.2: 2011-11-09
    Changes: Database references
  • Version 1.3: 2017-11-08
    Changes: Advisory, Refinement description
  • Version 1.4: 2024-02-28
    Changes: Advisory, Data collection, Database references, Derived calculations