Estimation of Hydrogen-Exchange Protection Factors from MD Simulation Based on Amide Hydrogen Bonding Analysis.
Park, I.H., Venable, J.D., Steckler, C., Cellitti, S.E., Lesley, S.A., Spraggon, G., Brock, A.(2015) J Chem Inf Model 55: 1914-1925
- PubMed: 26241692 Search on PubMedSearch on PubMed Central
- DOI: https://doi.org/10.1021/acs.jcim.5b00185
- Primary Citation Related Structures:
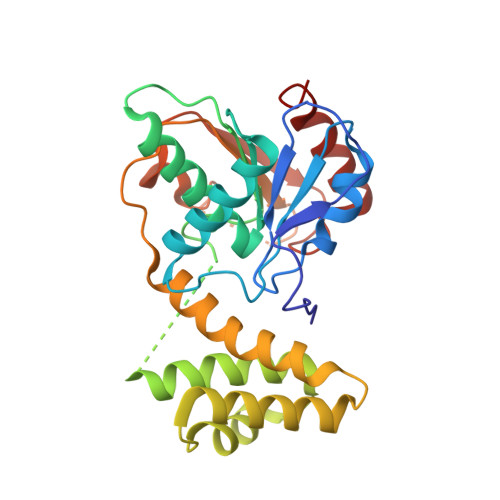
4Z49 - PubMed Abstract:
Hydrogen exchange (HX) studies have provided critical insight into our understanding of protein folding, structure, and dynamics. More recently, hydrogen exchange mass spectrometry (HX-MS) has become a widely applicable tool for HX studies. The interpretation of the wealth of data generated by HX-MS experiments as well as other HX methods would greatly benefit from the availability of exchange predictions derived from structures or models for comparison with experiment. Most reported computational HX modeling studies have employed solvent-accessible-surface-area based metrics in attempts to interpret HX data on the basis of structures or models. In this study, a computational HX-MS prediction method based on classification of the amide hydrogen bonding modes mimicking the local unfolding model is demonstrated. Analysis of the NH bonding configurations from molecular dynamics (MD) simulation snapshots is used to determine partitioning over bonded and nonbonded NH states and is directly mapped into a protection factor (PF) using a logistics growth function. Predicted PFs are then used for calculating deuteration values of peptides and compared with experimental data. Hydrogen exchange MS data for fatty acid synthase thioesterase (FAS-TE) collected for a range of pHs and temperatures was used for detailed evaluation of the approach. High correlation between prediction and experiment for observable fragment peptides is observed in the FAS-TE and additional benchmarking systems that included various apo/holo proteins for which literature data were available. In addition, it is shown that HX modeling can improve experimental resolution through decomposition of in-exchange curves into rate classes, which correlate with prediction from MD. Successful rate class decompositions provide further evidence that the presented approach captures the underlying physical processes correctly at the single residue level. This assessment is further strengthened in a comparison of residue resolved protection factor predictions for staphylococcal nuclease with NMR data, which was also used to compare prediction performance with other algorithms described in the literature. The demonstrated transferable and scalable MD based HX prediction approach adds significantly to the available tools for HX-MS data interpretation based on available structures and models.
- Genomics Institute of the Novartis Research Foundation , 10675 John Jay Hopkins Drive, San Diego, California 92121, United States.
Organizational Affiliation: