5OAI

Structure of MDM2 with low molecular weight inhibitor


Experimental Data Snapshot

  • Method: X-RAY DIFFRACTION
  • Resolution: 2.00 Å
  • R-Value Free: 0.227 
  • R-Value Work: 0.216 
  • R-Value Observed: 0.216 

wwPDB Validation   3D Report Full Report


Ligand Structure Quality Assessment 


This is version 1.2 of the entry. See complete history


Literature

A fluorinated indole-based MDM2 antagonist selectively inhibits the growth of p53wtosteosarcoma cells.

Skalniak, L.Twarda-Clapa, A.Neochoritis, C.G.Surmiak, E.Machula, M.Wisniewska, A.Labuzek, B.Ali, A.M.Krzanik, S.Dubin, G.Groves, M.Domling, A.Holak, T.A.

(2019) FEBS J 286: 1360-1374

  • DOI: https://doi.org/10.1111/febs.14774
  • Primary Citation of Related Structures:  
    5OAI

  • PubMed Abstract: 

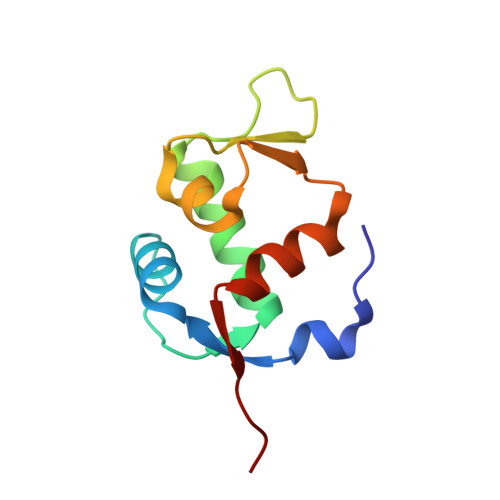
    The p53 protein is engaged in the repair of DNA mutations and elimination of heavily damaged cells, providing anticancer protection. Dysregulation of p53 activity is a crucial step in carcinogenesis. This dysregulation is often caused by the overexpression of negative regulators of p53, among which MDM2 is the most prominent one. Antagonizing MDM2 with small molecules restores the activity of p53 in p53 wild-type (p53 wt ) cells and thus provides positive outcomes in the treatment of p53 wt cancers. Previously, we have reported the discovery of a panel of fluoro-substituted indole-based antagonists of MDM2. Here, we demonstrate the biological activity and stereoselectivity of the most active compound from this series. Both enantiomers of the esterified form of the compound, as well as its corresponding carboxylic acids, were found active in fluorescence polarization (FP) assay, nuclear magnetic resonance (NMR) and microscale thermophoresis (MST) assay, with K i and K D values around 1 μm. From these four compounds, the esterified enantiomer (R)-5a was active in cells, which was evidenced by the increase of p53 levels, the induced expression of p53-target genes (CDKN1A and MDM2), the selective induction of cell cycle arrest, and selective growth inhibition of p53 wt U-2 OS and SJSA-1 compared to p53 del SAOS-2 cells. The analysis of the crystal structure of human MDM2 in complex with the compound (R)-6a (carboxylic acid of the active (R)-5a compound) revealed the classical three-finger binding mode. Altogether, our data demonstrate the activity of the compound and provide the structural basis for further structure optimization.


  • Organizational Affiliation

    Faculty of Chemistry, Jagiellonian University, Krakow, Poland.


Macromolecules
Find similar proteins by:  (by identity cutoff)  |  3D Structure
Entity ID: 1
MoleculeChains Sequence LengthOrganismDetailsImage
E3 ubiquitin-protein ligase Mdm297Homo sapiensMutation(s): 0 
Gene Names: MDM2
EC: 2.3.2.27
UniProt & NIH Common Fund Data Resources
Find proteins for Q00987 (Homo sapiens)
Explore Q00987 
Go to UniProtKB:  Q00987
PHAROS:  Q00987
GTEx:  ENSG00000135679 
Entity Groups  
Sequence Clusters30% Identity50% Identity70% Identity90% Identity95% Identity100% Identity
UniProt GroupQ00987
Sequence Annotations
Expand
  • Reference Sequence
Small Molecules
Ligands 1 Unique
IDChains Name / Formula / InChI Key2D Diagram3D Interactions
B5K
Query on B5K

Download Ideal Coordinates CCD File 
B [auth A]3-[(1~{R})-2-(~{tert}-butylamino)-1-[methanoyl-[[3,4,5-tris(fluoranyl)phenyl]methyl]amino]-2-oxidanylidene-ethyl]-6-chloranyl-1~{H}-indole-2-carboxylic acid
C23 H21 Cl F3 N3 O4
FZINKXKQKUDBDP-HXUWFJFHSA-N
Binding Affinity Annotations 
IDSourceBinding Affinity
B5K Binding MOAD:  5OAI Ki: 100 (nM) from 1 assay(s)
BindingDB:  5OAI Ki: min: 0.13, max: 130 (nM) from 2 assay(s)
Experimental Data & Validation

Experimental Data

  • Method: X-RAY DIFFRACTION
  • Resolution: 2.00 Å
  • R-Value Free: 0.227 
  • R-Value Work: 0.216 
  • R-Value Observed: 0.216 
  • Space Group: I 2 2 2
Unit Cell:
Length ( Å )Angle ( ˚ )
a = 49.731α = 90
b = 59.216β = 90
c = 83.897γ = 90
Software Package:
Software NamePurpose
PHENIXrefinement
SCALAdata scaling
XDSdata reduction
PHASERphasing

Structure Validation

View Full Validation Report


Ligand Structure Quality Assessment 


Entry History 

Deposition Data

Revision History  (Full details and data files)

  • Version 1.0: 2019-02-13
    Type: Initial release
  • Version 1.1: 2019-04-17
    Changes: Data collection, Database references
  • Version 1.2: 2024-01-17
    Changes: Data collection, Database references, Refinement description