5WBU

Crystal structure of mTOR(deltaN)-mLST8-PRAS40(alpha-helix & beta-strand) complex


Experimental Data Snapshot

  • Method: X-RAY DIFFRACTION
  • Resolution: 3.42 Å
  • R-Value Free: 0.266 
  • R-Value Work: 0.235 
  • R-Value Observed: 0.235 

wwPDB Validation   3D Report Full Report


This is version 1.2 of the entry. See complete history


Literature

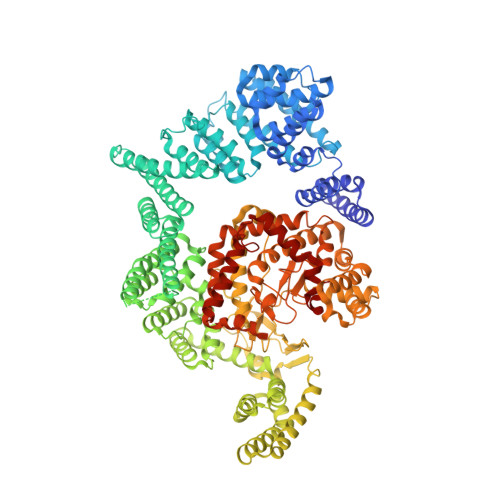
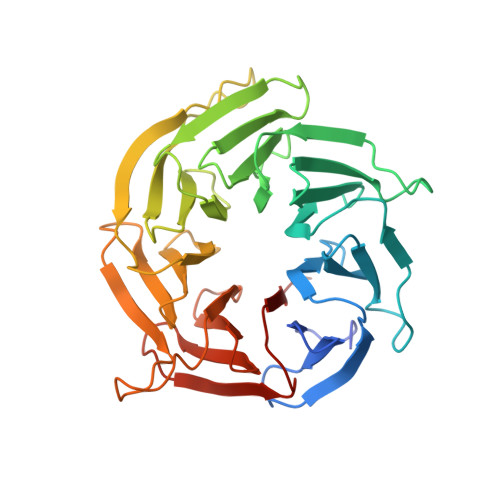
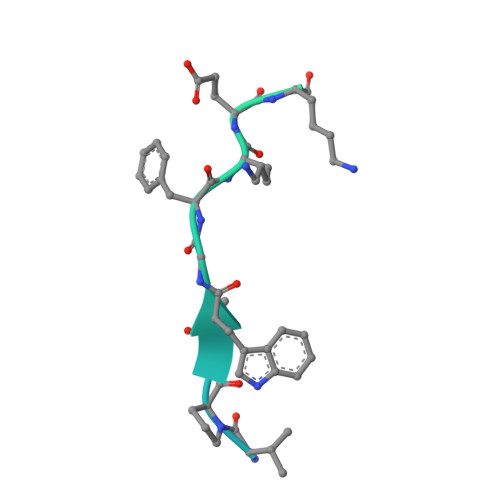
Mechanisms of mTORC1 activation by RHEB and inhibition by PRAS40.

Yang, H.Jiang, X.Li, B.Yang, H.J.Miller, M.Yang, A.Dhar, A.Pavletich, N.P.

(2017) Nature 552: 368-373

  • DOI: https://doi.org/10.1038/nature25023
  • Primary Citation of Related Structures:  
    5WBH, 5WBI, 5WBJ, 5WBK, 5WBL, 5WBU, 5WBY, 6BCU, 6BCX

  • PubMed Abstract: 

    The mechanistic target of rapamycin complex 1 (mTORC1) controls cell growth and metabolism in response to nutrients, energy levels, and growth factors. It contains the atypical kinase mTOR and the RAPTOR subunit that binds to the Tor signalling sequence (TOS) motif of substrates and regulators. mTORC1 is activated by the small GTPase RHEB (Ras homologue enriched in brain) and inhibited by PRAS40. Here we present the 3.0 ångström cryo-electron microscopy structure of mTORC1 and the 3.4 ångström structure of activated RHEB-mTORC1. RHEB binds to mTOR distally from the kinase active site, yet causes a global conformational change that allosterically realigns active-site residues, accelerating catalysis. Cancer-associated hyperactivating mutations map to structural elements that maintain the inactive state, and we provide biochemical evidence that they mimic RHEB relieving auto-inhibition. We also present crystal structures of RAPTOR-TOS motif complexes that define the determinants of TOS recognition, of an mTOR FKBP12-rapamycin-binding (FRB) domain-substrate complex that establishes a second substrate-recruitment mechanism, and of a truncated mTOR-PRAS40 complex that reveals PRAS40 inhibits both substrate-recruitment sites. These findings help explain how mTORC1 selects its substrates, how its kinase activity is controlled, and how it is activated by cancer-associated mutations.


  • Organizational Affiliation

    Structural Biology Program, Memorial Sloan Kettering Cancer Center, New York, New York 10065, USA.


Macromolecules
Find similar proteins by:  (by identity cutoff)  |  3D Structure
Entity ID: 1
MoleculeChains Sequence LengthOrganismDetailsImage
Serine/threonine-protein kinase mTORA [auth B],
E [auth A]
1,177Homo sapiensMutation(s): 0 
Gene Names: MTORFRAPFRAP1FRAP2RAFT1RAPT1
EC: 2.7.11.1
UniProt & NIH Common Fund Data Resources
Find proteins for P42345 (Homo sapiens)
Explore P42345 
Go to UniProtKB:  P42345
PHAROS:  P42345
GTEx:  ENSG00000198793 
Entity Groups  
Sequence Clusters30% Identity50% Identity70% Identity90% Identity95% Identity100% Identity
UniProt GroupP42345
Sequence Annotations
Expand
  • Reference Sequence
Find similar proteins by:  (by identity cutoff)  |  3D Structure
Entity ID: 2
MoleculeChains Sequence LengthOrganismDetailsImage
Target of rapamycin complex subunit LST8B [auth D],
F [auth C]
328Homo sapiensMutation(s): 0 
Gene Names: MLST8GBLLST8
UniProt & NIH Common Fund Data Resources
Find proteins for Q9BVC4 (Homo sapiens)
Explore Q9BVC4 
Go to UniProtKB:  Q9BVC4
PHAROS:  Q9BVC4
GTEx:  ENSG00000167965 
Entity Groups  
Sequence Clusters30% Identity50% Identity70% Identity90% Identity95% Identity100% Identity
UniProt GroupQ9BVC4
Sequence Annotations
Expand
  • Reference Sequence
Find similar proteins by:  (by identity cutoff)  |  3D Structure
Entity ID: 3
MoleculeChains Sequence LengthOrganismDetailsImage
Proline-rich AKT1 substrate 1C [auth P],
D [auth R],
G [auth O],
H [auth Q]
88Homo sapiensMutation(s): 0 
Gene Names: AKT1S1PRAS40
UniProt & NIH Common Fund Data Resources
Find proteins for Q96B36 (Homo sapiens)
Explore Q96B36 
Go to UniProtKB:  Q96B36
PHAROS:  Q96B36
GTEx:  ENSG00000204673 
Entity Groups  
Sequence Clusters30% Identity50% Identity70% Identity90% Identity95% Identity100% Identity
UniProt GroupQ96B36
Sequence Annotations
Expand
  • Reference Sequence
Experimental Data & Validation

Experimental Data

  • Method: X-RAY DIFFRACTION
  • Resolution: 3.42 Å
  • R-Value Free: 0.266 
  • R-Value Work: 0.235 
  • R-Value Observed: 0.235 
  • Space Group: P 2 21 21
Unit Cell:
Length ( Å )Angle ( ˚ )
a = 139.4α = 90
b = 163.2β = 90
c = 207.8γ = 90
Software Package:
Software NamePurpose
REFMACrefinement
SCALEPACKdata scaling
PDB_EXTRACTdata extraction
HKL-2000data reduction
PHASERphasing

Structure Validation

View Full Validation Report


Entry History 

Deposition Data

Revision History  (Full details and data files)

  • Version 1.0: 2017-12-20
    Type: Initial release
  • Version 1.1: 2018-01-10
    Changes: Database references
  • Version 1.2: 2023-10-04
    Changes: Data collection, Database references, Refinement description