3RSC | pdb_00003rsc

Crystal Structure of CalG2, Calicheamicin Glycosyltransferase, TDP and calicheamicin T0 bound form


Experimental Data Snapshot

  • Method: X-RAY DIFFRACTION
  • Resolution: 2.19 Å
  • R-Value Free: 
    0.239 (Depositor), 0.233 (DCC) 
  • R-Value Work: 
    0.197 (Depositor) 
  • R-Value Observed: 
    0.199 (Depositor) 

wwPDB Validation 3D Report Full Report

Validation slider image for 3RSC

Ligand Structure Quality Assessment 


This is version 1.5 of the entry. See complete history

Literature

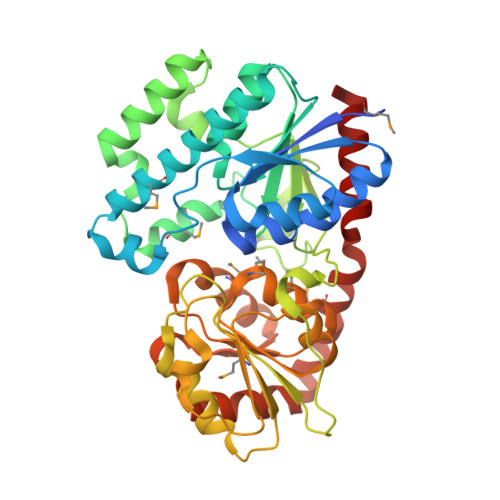
Complete set of glycosyltransferase structures in the calicheamicin biosynthetic pathway reveals the origin of regiospecificity.

Chang, A.Singh, S.Helmich, K.E.Goff, R.D.Bingman, C.A.Thorson, J.S.Phillips, G.N.

(2011) Proc Natl Acad Sci U S A 108: 17649-17654

  • DOI: https://doi.org/10.1073/pnas.1108484108
  • Primary Citation Related Structures: 
    3IA7, 3IAA, 3OTG, 3OTH, 3OTI, 3RSC

  • PubMed Abstract: 

    Glycosyltransferases are useful synthetic catalysts for generating natural products with sugar moieties. Although several natural product glycosyltransferase structures have been reported, design principles of glycosyltransferase engineering for the generation of glycodiversified natural products has fallen short of its promise, partly due to a lack of understanding of the relationship between structure and function. Here, we report structures of all four calicheamicin glycosyltransferases (CalG1, CalG2, CalG3, and CalG4), whose catalytic functions are clearly regiospecific. Comparison of these four structures reveals a conserved sugar donor binding motif and the principles of acceptor binding region reshaping. Among them, CalG2 possesses a unique catalytic motif for glycosylation of hydroxylamine. Multiple glycosyltransferase structures in a single natural product biosynthetic pathway are a valuable resource for understanding regiospecific reactions and substrate selectivities and will help future glycosyltransferase engineering.


  • Organizational Affiliation
    • Department of Biochemistry, University of Wisconsin, 433 Babcock Drive, Madison, WI 53706, USA.

Macromolecule Content 

  • Total Structure Weight: 94.01 kDa 
  • Atom Count: 6,578 
  • Modeled Residue Count: 794 
  • Deposited Residue Count: 830 
  • Unique protein chains: 1

Macromolecules

Find similar proteins by:|  3D Structure
Entity ID: 1
MoleculeChains  Sequence LengthOrganismDetailsImage
CalG2
A, B
415Micromonospora echinosporaMutation(s): 0 
Gene Names: calG2
UniProt
Find proteins for Q8KNE0 (Micromonospora echinospora)
Explore Q8KNE0 
Go to UniProtKB:  Q8KNE0
Entity Groups
Sequence Clusters30% Identity50% Identity70% Identity90% Identity95% Identity100% Identity
UniProt GroupQ8KNE0
Sequence Annotations
Expand
Reference Sequence

Small Molecules

Ligands 3 Unique
IDChains Name / Formula / InChI Key2D Diagram3D Interactions
C0T

Query on C0T


Download:Ideal Coordinates CCD File
D [auth A],
I [auth B]
Calicheamicin T0
C24 H28 N2 O9 S3
HIXBTEQHDWBCIJ-JZCXNSNGSA-N
TYD

Query on TYD


Download:Ideal Coordinates CCD File
C [auth A],
H [auth B]
THYMIDINE-5'-DIPHOSPHATE
C10 H16 N2 O11 P2
UJLXYODCHAELLY-XLPZGREQSA-N
PO4

Query on PO4


Download:Ideal Coordinates CCD File
E [auth A]
F [auth A]
G [auth A]
J [auth B]
K [auth B]
E [auth A],
F [auth A],
G [auth A],
J [auth B],
K [auth B],
L [auth B],
M [auth B],
N [auth B]
PHOSPHATE ION
O4 P
NBIIXXVUZAFLBC-UHFFFAOYSA-K
Modified Residues  1 Unique
IDChains TypeFormula2D DiagramParent
MSE
Query on MSE
A, B
L-PEPTIDE LINKINGC5 H11 N O2 SeMET

Experimental Data & Validation

Experimental Data

  • Method: X-RAY DIFFRACTION
  • Resolution: 2.19 Å
  • R-Value Free:  0.239 (Depositor), 0.233 (DCC) 
  • R-Value Work:  0.197 (Depositor) 
  • R-Value Observed: 0.199 (Depositor) 
Space Group: P 1 21 1
Unit Cell:
Length ( Å )Angle ( ˚ )
a = 88.289α = 90
b = 48.592β = 101.71
c = 108.393γ = 90
Software Package:
Software NamePurpose
DENZOdata reduction
SCALEPACKdata scaling
PHASERphasing
PHENIXrefinement
PDB_EXTRACTdata extraction
HKL-2000data collection
HKL-2000data reduction
HKL-2000data scaling
PHENIXphasing

Structure Validation

View Full Validation Report


Ligand Structure Quality Assessment 


Entry History 

Revision History  (Full details and data files)

  • Version 1.0: 2011-08-10
    Type: Initial release
  • Version 1.1: 2011-08-17
    Changes: Structure summary
  • Version 1.2: 2011-11-02
    Changes: Database references
  • Version 1.3: 2012-08-08
    Changes: Structure summary
  • Version 1.4: 2017-11-08
    Changes: Refinement description
  • Version 1.5: 2024-10-30
    Changes: Data collection, Database references, Derived calculations, Structure summary